Measure to Manage
Local Knowledge
A lot of growers were undoubtedly nodding as they listened to Dani Gelardi introduce the conclusion of the Washington State Department of Agriculture’s “Making Soil Data Actionable” webinar series. Gelardi, the Senior Soil Scientist and Climate Coordinator for WSDA, hit the nail on the head.
“We love soil data, and we also know that it can be confusing,” she said. “More soil tests and data are available to farmers than ever, and while this can be empowering, it can be difficult to translate into action.”
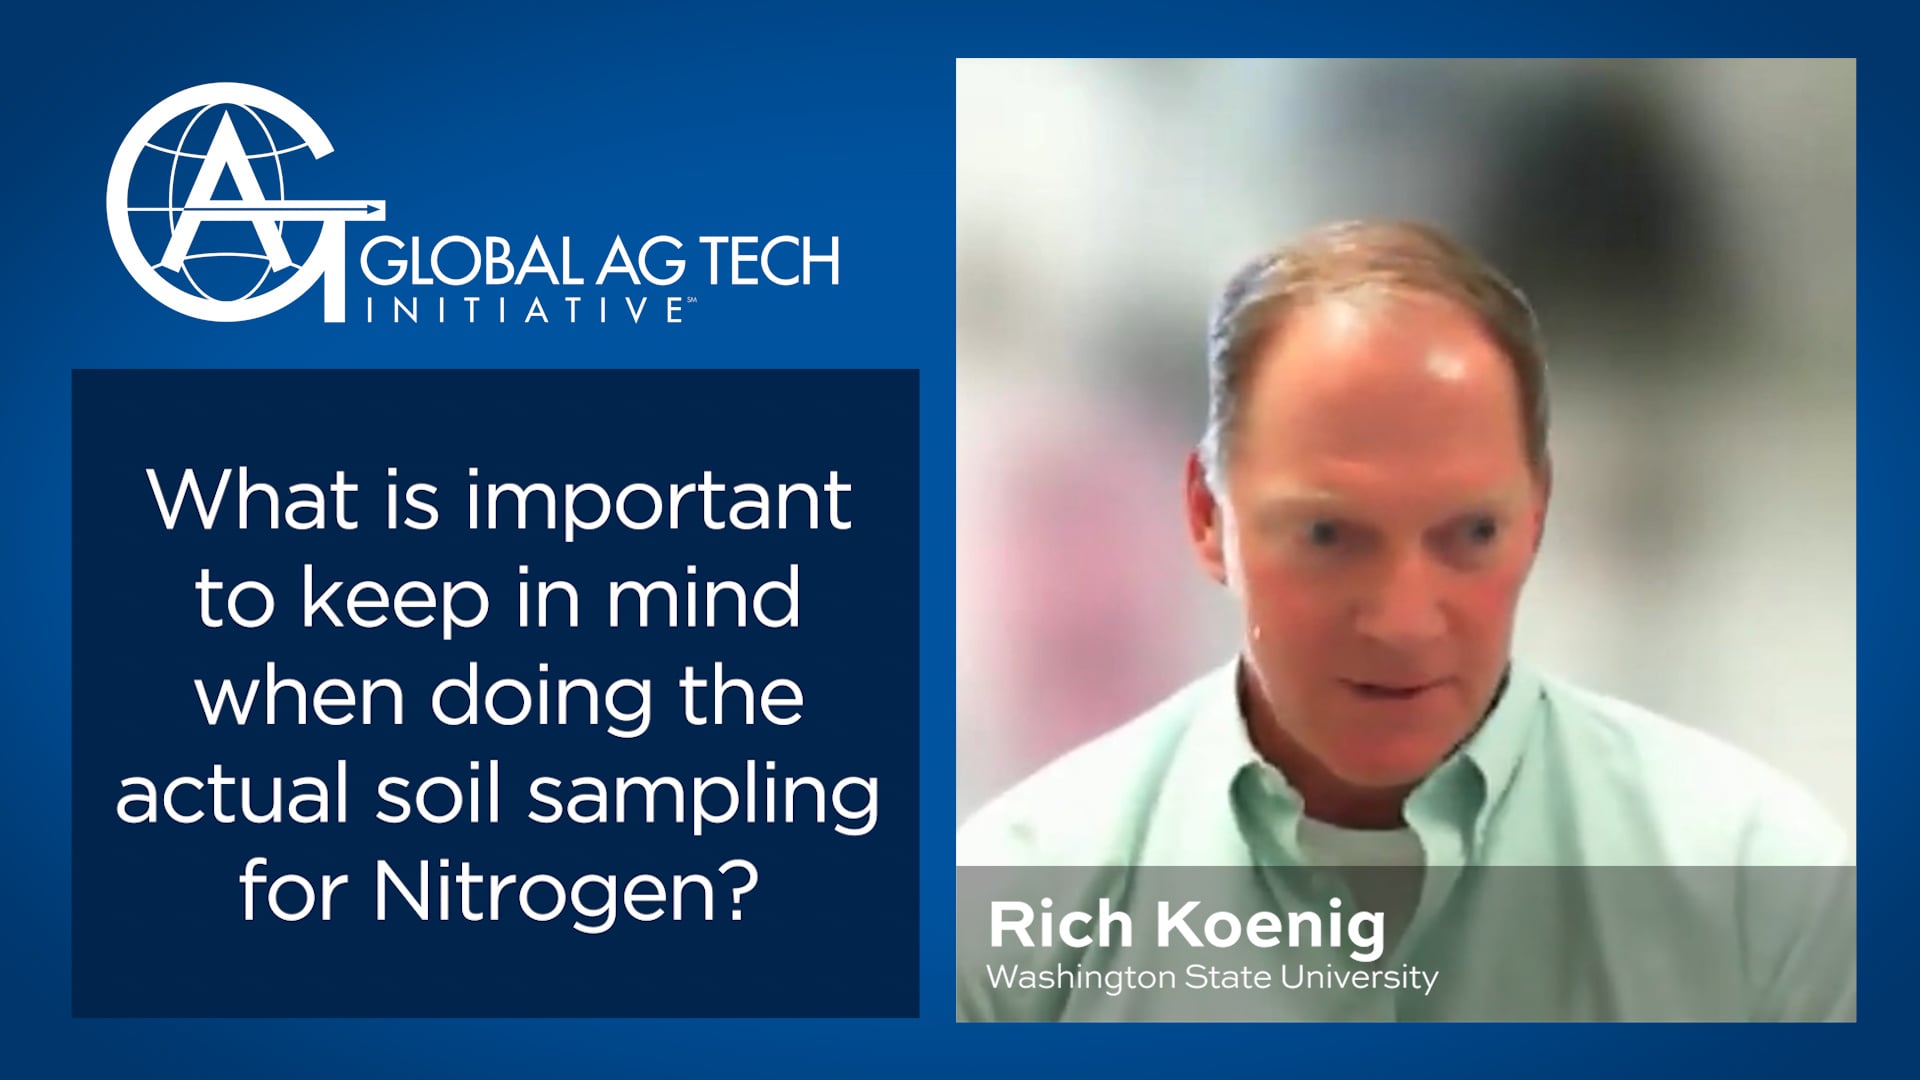
Galardi introduced sometime translator and fulltime Soil Scientist Rich Koenig, an Extension Specialist in the Department of Crop and Soil Sciences, Washington State University. Koenig outlined the importance of Nitrogen (N) credits in the fertilizer budgeting process.
The chief economic advantage is pretty obvious. If growers can determine, through careful soil sampling, that there is a fair amount of N in their ground already, they don’t need to buy as much fertilizer. Foregoing such tests can be pretty risky, however, especially for growers in certain parts of the world where the government has stepped in to restrict N fertilizer use because of concerns about nitrate levels in groundwater.
In the U.S., growers in California or along the southern Mississippi River can actually face fines for contributing to high N levels. But if they test their soils, they can avoid such problems and become better stewards of the land resource. Growers can use soil tests as a diagnostic tool or to identify trends through time. To obtain meaningful test results, you must sample soil correctly, at the same time each year, and you must maintain records.
Growers can use soil tests as a diagnostic tool or to identify trends through time. To obtain meaningful test results, you must sample soil correctly, at the same time each year, and you must maintain records.
Because soils vary so much, and crop needs are so different, Koenig says growers would be wise to avail themselves of the many nutrient management guides available online, which generally either address a certain region or crop. There's some form of nitrogen crediting process embedded within those nutrient management guides, which cover crops from cranberries to Christmas trees.
Koenig says one thing to be aware of, when measuring soil residual nitrogen, is that it's a point sample, both in terms of time and space, and therefore has some limitations. The effects will, of course, depend on where they are taken. For instance, the spatial variability would not ordinarily be as great in flat fields as on steep hillsides.
It’s also critical for growers to keep in mind that soil tests are used to measure soil nutrients that are expected to become plant-available, not the total amounts of nutrients in soil. Measurements of total nutrient content are not useful indicators of sufficiency for plant growth, because only a small portion of the nutrients in soil are plant-available. The plant-available forms of nitrogen are ammonium-N (NH4 -N) and nitrate-N (NO3 -N).
Though soil tests might show total N, it includes N in all organic and inorganic forms. Total N does not indicate plant available N and is not the sum of NH4 -N + NO3 -N. Total N is not used for fertilizer recommendations.
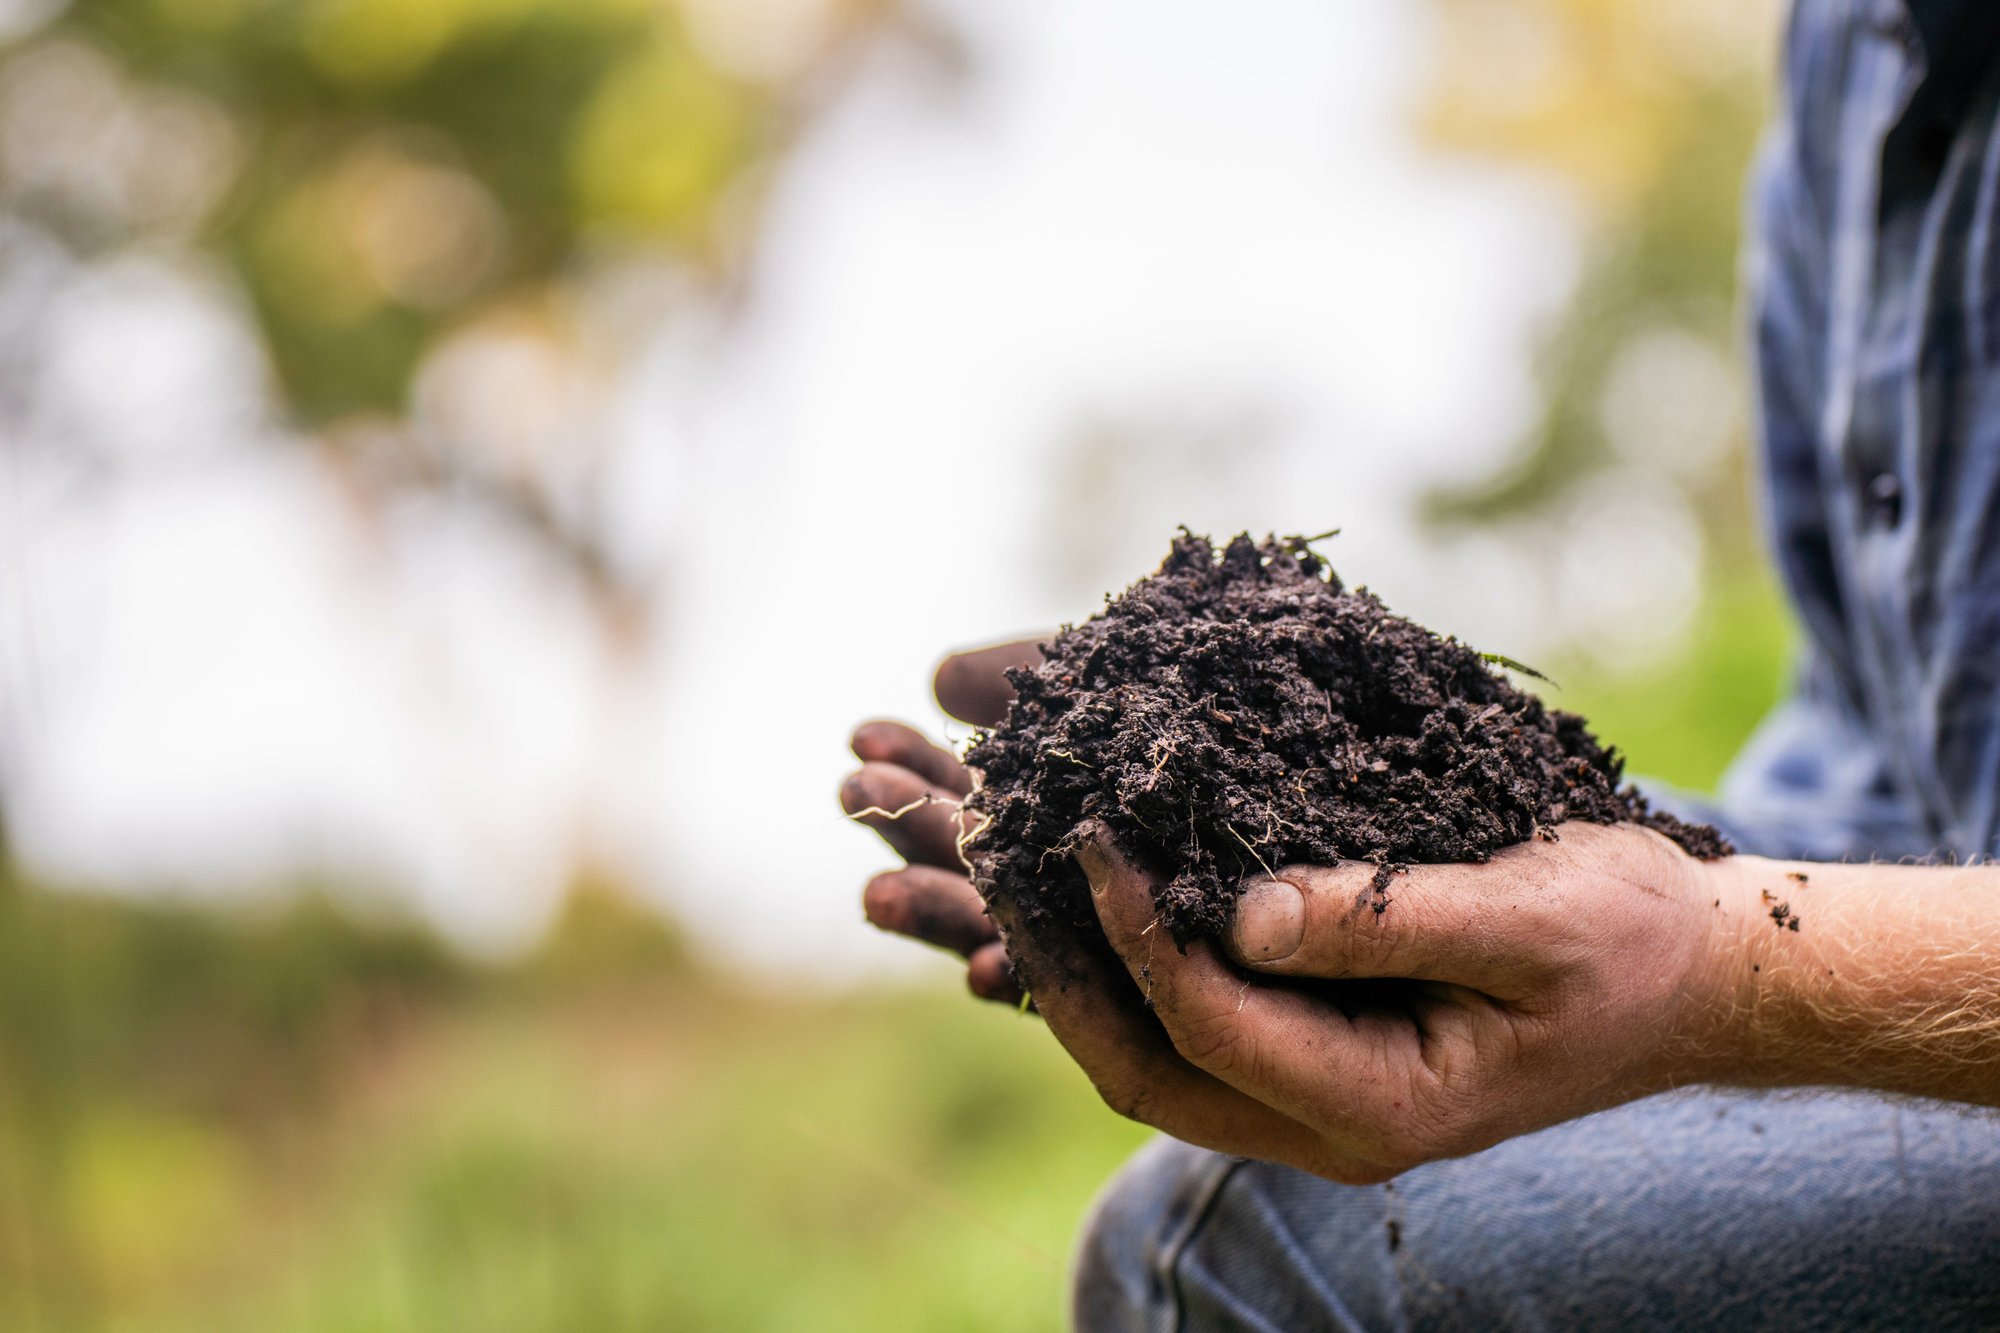
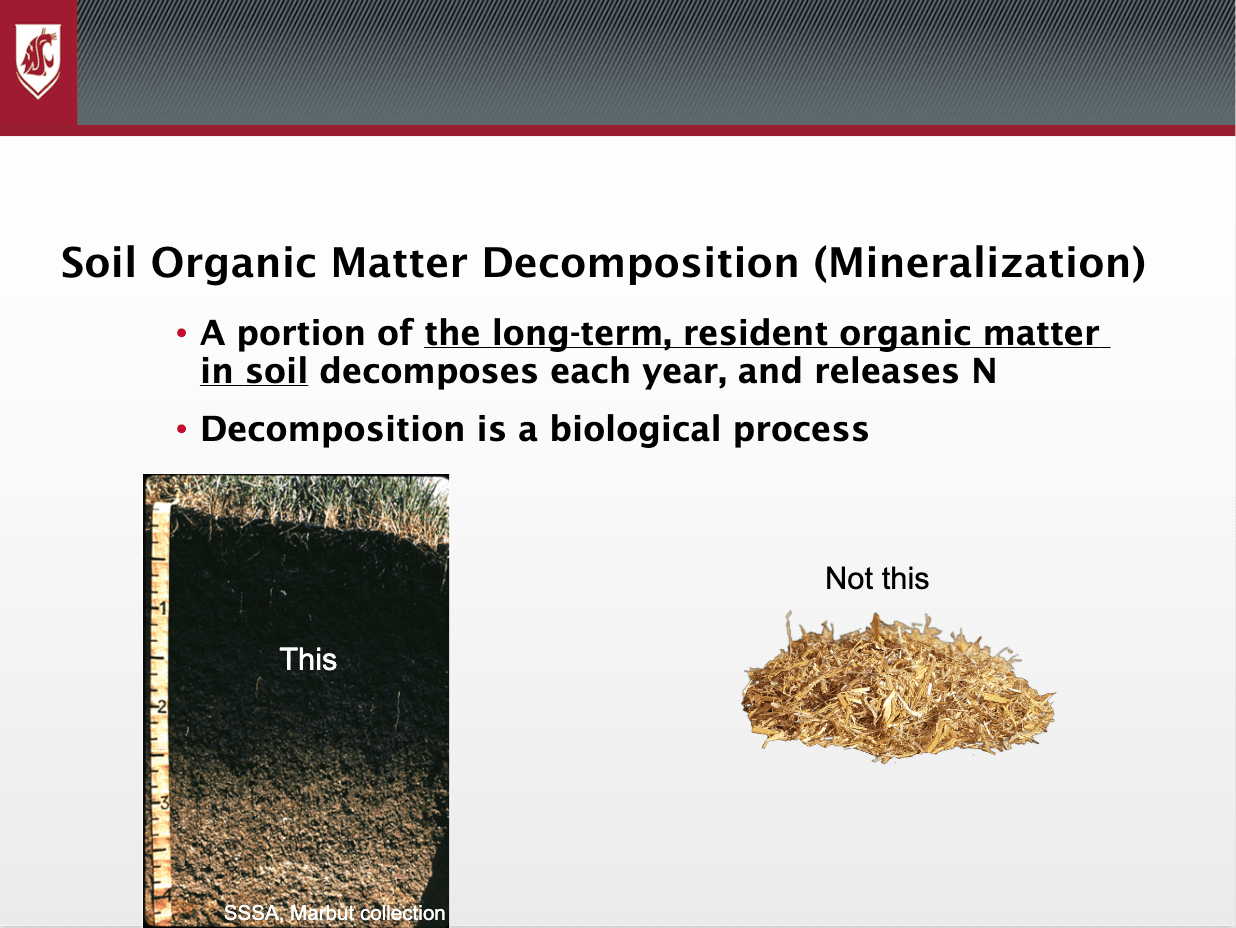
Soil Organic Matter Decomposition (Mineralization)
"When we’re referring to soil organic matter decomposition, what we’re talking about is this, this dark-colored humic material, the organic matter that’s has been there for decades, if not centuries,” Rich Koenig says.
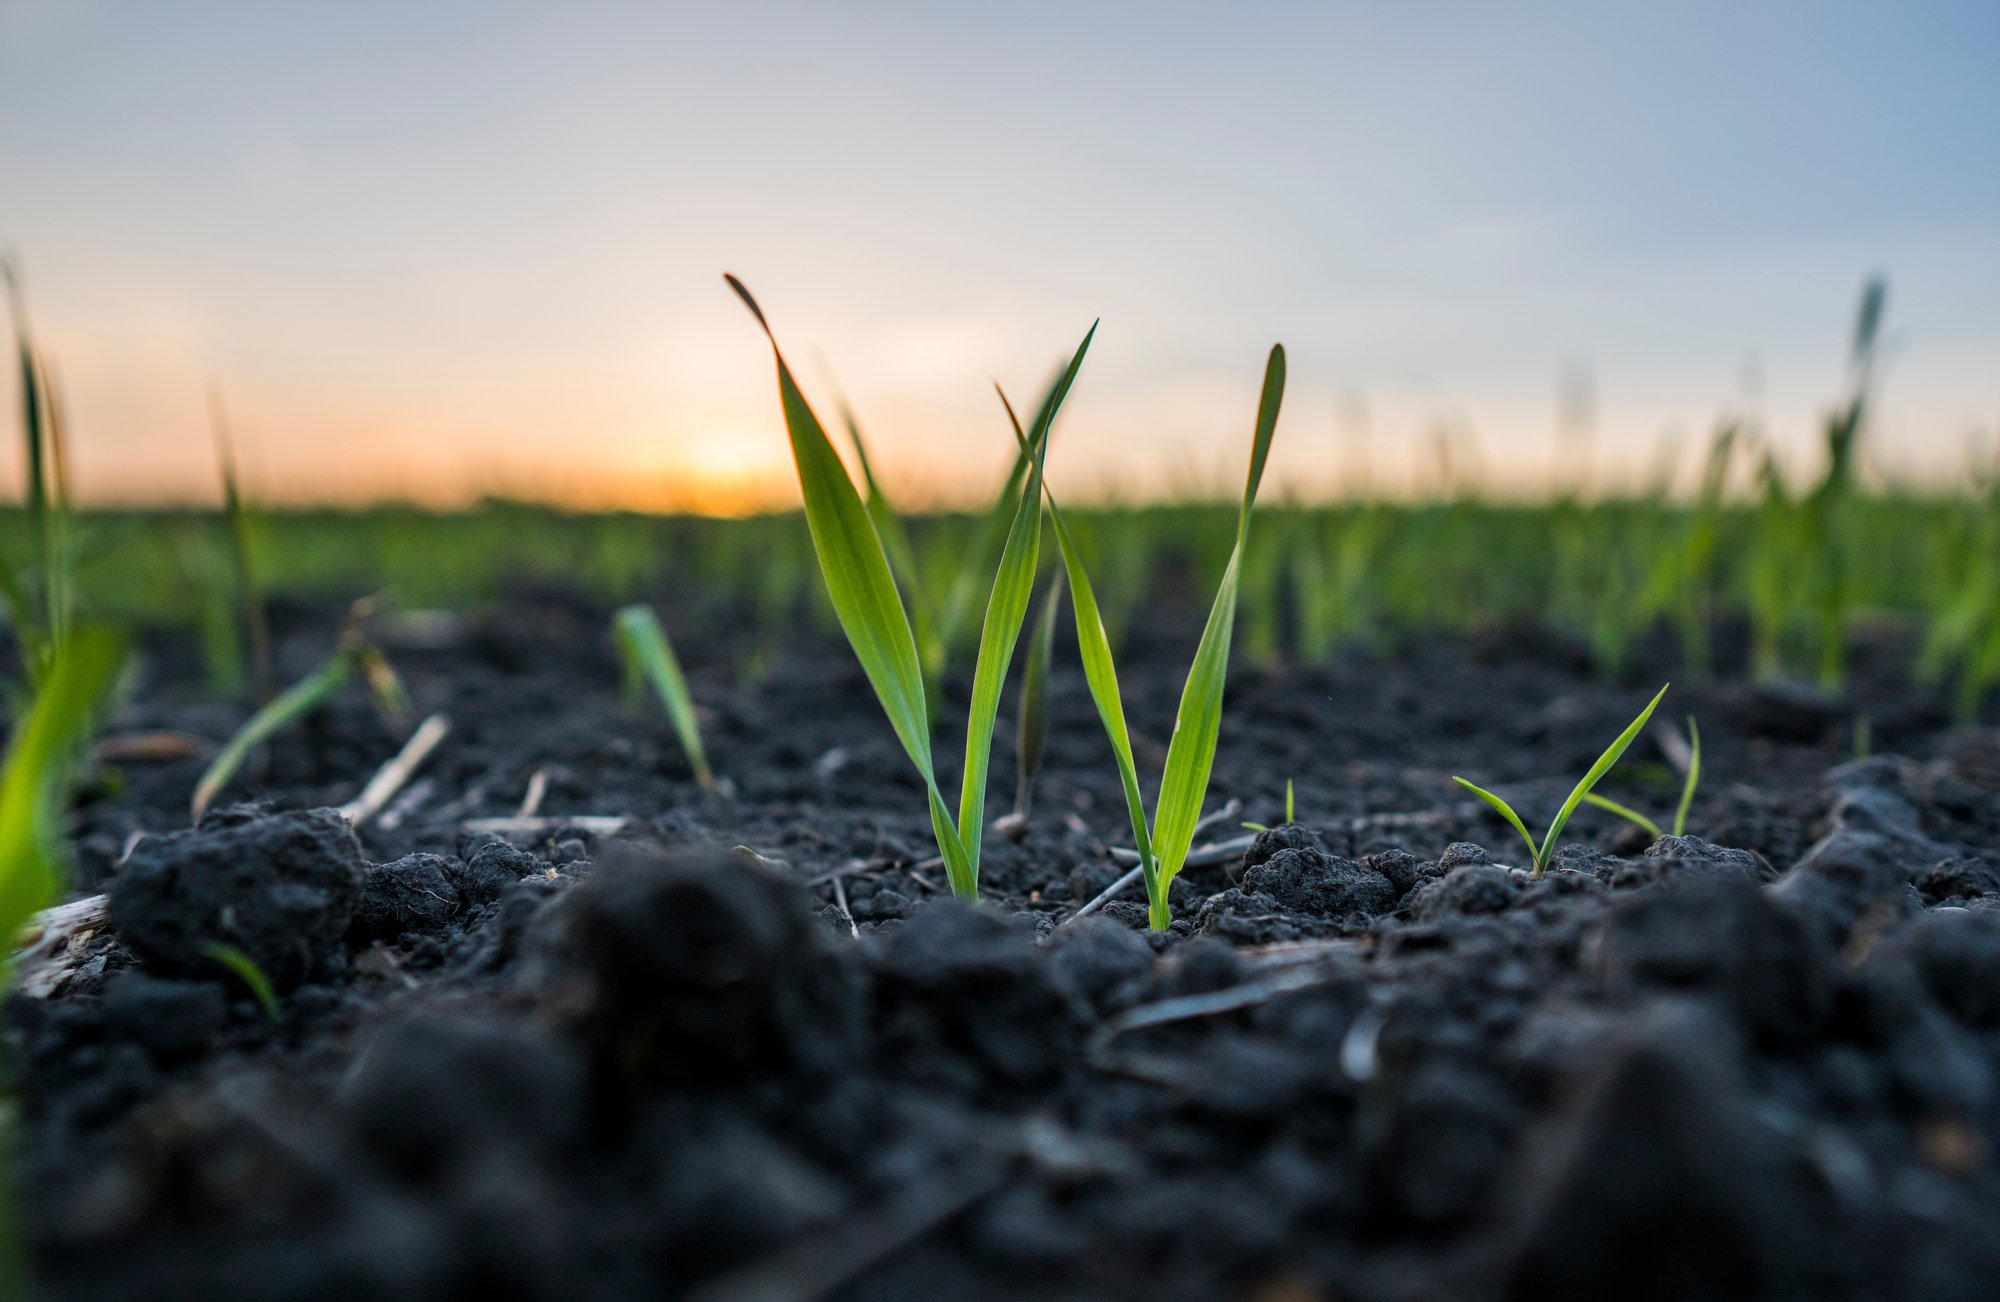
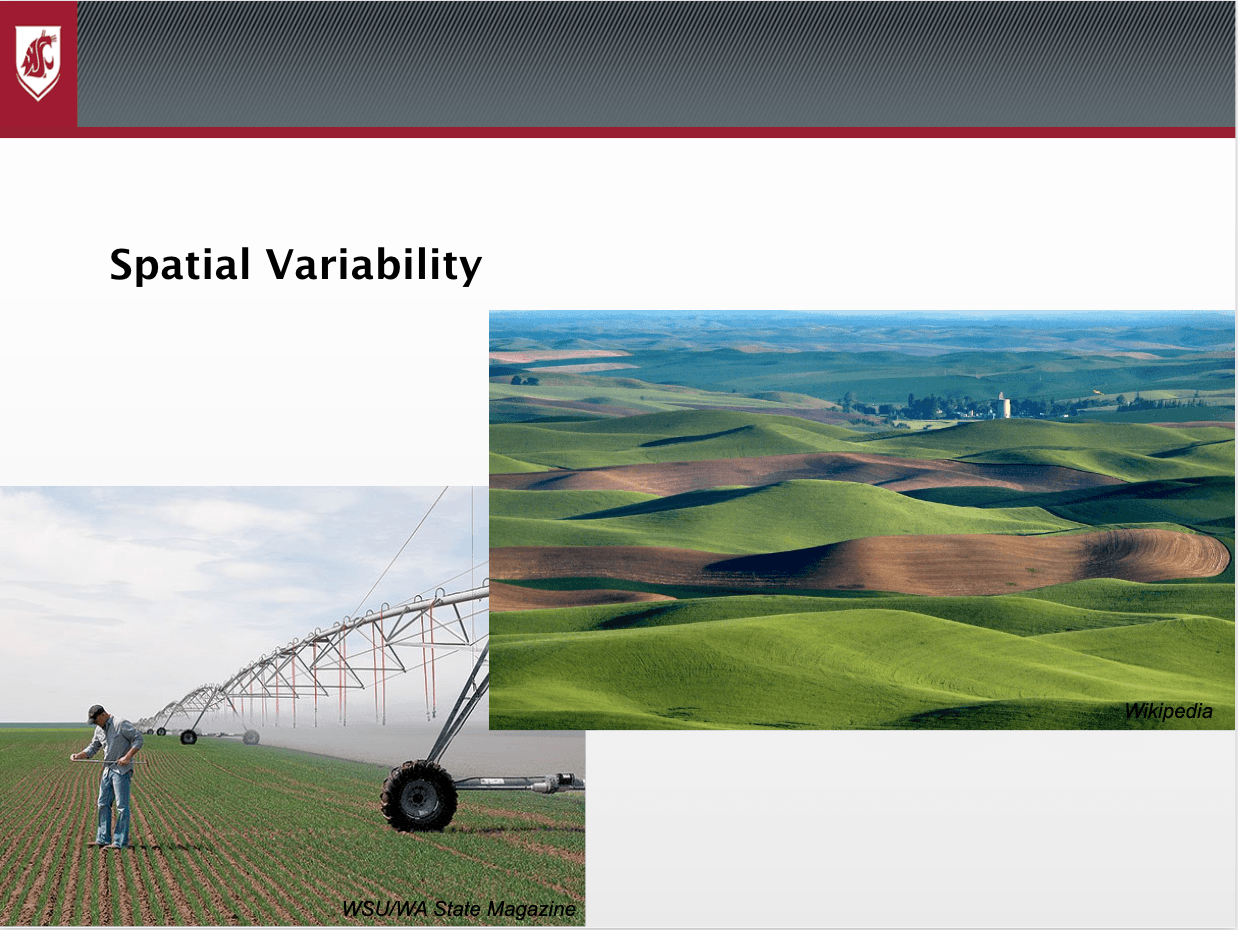
Spatial Variability
These two photos demonstrate the variability of soils that can be found in the state of Washington. Out on the Palouse (top), the most productive wheat growing region in the U.S., the nitrogen levels can vary widely, depending where on the undulating terrain the soil test is taken. Down in the pool table-flat Columbia Basin, spatial variability is far less of a consideration.
Koenig says because representative sampling is so difficult, it’s vital to have someone on hand who really knows the area well. Nobody knows their ground like an experienced grower, and growers should rely on that experience to select points that have shown more-or-less-average production in the past.
“Soil type is critically important to guide your sampling scheme,” he says. “You can’t just call someone and have them sample with nothing to go on. Some knowledge of the field is required.”
Once you collect the sample, send it to one of many commercial labs, which are easy to find in most agricultural regions of the country, Koenig says. He showed a typical report with a few common numbers. One is parts per million (ppm), which is expressing results as pounds of N per million pounds of soil. He said the average soil has a bulk density of 1.4 grams per cubic centimeter, and there are about 4 million pounds of soil in an acre-foot. So, if you multiply by 4, the number of million pounds in an acre-foot of soil, you can scale up to pounds of N per acre.
“This is a common calculation that's done often,” he says. “Test reports will present nitrate and ammonium concentrations in parts per million, but also in pounds per acre. But it’s important to know how that that amount, pounds per acre, is calculated into the future.”
Many labs also offer a nice dashboard of the results, Koenig notes. They give you an interpretation of the test results, not just for N, but other nutrients as well. Often such dashboards include recommendations.
Finally, Koenig emphasizes that some growers may want to sample deeper than one foot. In the dryland areas of Eastern Washington, they often go as low as 4 feet, 5 feet, or even 6 feet, because they know that spring and winter wheat are often capable of rooting to those depths. Even with more shallow-rooted crops, besides knowing what’s going on in the rootzone, growers can find it instructive to learn what’s going on below the rootzone.
“Many sample just for the top foot of soil, but we can go deeper,” he says. “It’s often informative to collect the soil profile, a collection of samples in one-foot increments from the surface down as deep as you’re willing or able to go.”
For interested growers, to determine the amount of available N, or the amount of organic matter in your soil, there are sources available online. Koenig suggests researching labs through this database: http://analyticallabs.puyallup.wsu.edu.